This is so important! Crosspost of an essay by Daniel Kay Hertz, from the excellent City Observatory blog, where it was titled "Urban residents aren't abandoning buses: buses are abandoning them."
“Pity the poor city bus,” writes Jacob Anbinder in an interesting essay at The Century Foundation’s website. Anbinder brings some of his own data to a finding that’s been bouncing around the web for a while: that even as American subways and light rail systems experience a renaissance across the country, bus ridership has been falling nationally since the start of the Great Recession.
But it’s not buses that are being abandoned. It’s bus riders.
The drop in bus ridership over the last several years has been mirrored by a decline in bus service, even as transit agencies have managed to resume increasing frequency and hours on all types of rail lines – heavy, light, and commuter.* (In this post, "service" means vehicle revenue miles – literally, multiplying a city's bus or rail vehicles by the number of miles they run on their routes.) After a post-recession low in 2011, by 2013 rail service had increased by over 4% nationally in urban areas of at least one million people. Light rail in particular has continued its decade-plus boom, with a service increase of more than 12% in just two years. By contrast, bus service – which already took a heavier hit in the first years of the recession – was cut an additional 5.8%.
And it turns out that when you disaggregate the national data by urban area, there’s a very tight relationship between places that cut bus service between 2000 and 2013 and those that saw the largest drops in ridership. If you live in a city where bus service has been increased, it’s likely that your city has actually grown its bus ridership, despite the national trends. In other words, the problem doesn't seem to be that bus riders are deciding they’d rather just walk, bike, or take their city’s new light rail line. It’s that too many cities are cutting bus service to the point that people are giving up on them.
Admittedly, this is a crude way to demonstrate a very complicated relationship. To rigorously test the impact of bus service on ridership, you’d want to take into account all sorts of other things: the presence of other transit services; population density; gas prices; demographics; and so on.
Fortunately, we don't have to do that, because researchers at San Jose State University’s Mineta Transportation Institute just did it for us. And they found that even if you control for those other factors, service levels are still the number one predictor of bus ridership.
Still, I can imagine two big objections to the idea that cuts to bus operations are behind ridership declines. First, a lot of cities have opened new rail lines since 2000 – many of which, if not most, replaced heavily-trafficked bus routes. In those cases, cities are adding rail service and reducing bus service, but it obviously wouldn’t be right to say that those bus riders are being abandoned.
But while that has surely happened in some places, it just doesn’t match the overall data. Rail service, including new lines, has been booming since long before the recession – but up until about 2009, bus service was growing, too, or at least holding steady. If rail expansions were driving bus cuts, you’d expect to see those cuts all the way back to the beginning of the data. But you don’t. Instead, cuts to bus routes appear right as transit funding was hit hard by the recession.
Second, you might argue that service and ridership are linked, but the other way around: as ridership declines, agencies cut back on hours and frequency to match demand. Teasing out which way the causation runs would be difficult – and the answer would almost certainly include at least some examples in both directions. One quick-and-dirty way to get an idea, though, is to compare ridership changes from one year to service changes in the next year. If agencies cut service because of earlier ridership declines, then you’d expect to see that places with larger drops in ridership in “Year One” tend to be the places with larger cuts to service in “Year Two.”
But, again, they don’t. In fact, just 3% of the variation in service cuts is explained by ridership changes from the year before.
So while that’s hardly ironclad – and I look forward to further research that sheds more light on this problem – it does appear that a major part of the divergence in bus and rail ridership is a result of a divergence in bus and rail service: since the recession, transit agencies have cut bus service year after year, while returning service to rail relatively quickly.
Why did they do that? I don’t know. But I can speculate that it has something to do with the fact that bus transit supporters are not always the same kinds of people as rail transit supporters. Even though more people take buses than trains in nearly every metropolitan area in the country, train riders, on average, tend to be wealthier and whiter. Not only that, but many civic and business leaders who don’t use transit at all are heavily invested in rail service as an economic development catalyst for central city neighborhoods. In other words, rail tends to have a more politically powerful constituency behind it than buses.
As a result, when the recession blew a hole in transit budgets around the country, it may have been politically easier for local governments to fill those holes by sustaining cuts to bus lines, rather than rail.
To be clear, the problem here has nothing to do with whether transit agencies are running more services that are rubber-on-asphalt or steel-on-tracks. As Jarrett Walker has eloquently argued, the technology used by a particular line matters far less than the quality of service: how often it runs, how quickly, for how much of the day.
But there are at least two problems here. First, because of the spread-out nature of even relatively dense American cities, it will be a very, very long time before rail transit can connect truly large numbers of people to large numbers of jobs and amenities. When Minneapolis opened the 12-mile Blue Line light rail in 2004, for example, it was a major step forward for Twin Cities transit – but still, only 2% of the region’s population lived close enough to walk to one of the stations. For everyone else, transit still meant taking the bus, even if they were taking the bus to a train station.
And even in places with well-developed rail networks, those systems are usually oriented to serve downtown commuters. Especially in outer neighborhoods, crosstown trips in places like Chicago, Boston, or DC are heavily reliant on buses. Abandoning buses means abandoning those trips, and the people who depend on them.
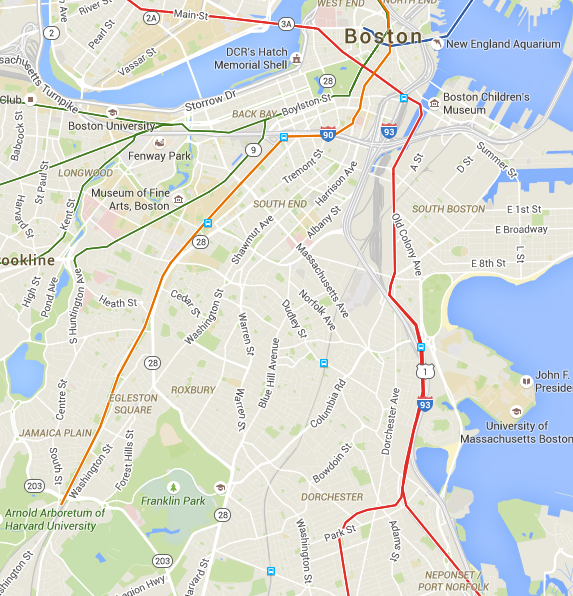 Boston's T reaches both Dorchester and Jamaica Plain, but a bus is by far the easiest way to get from one to the other on transit. Credit: Google Maps
Second, there are serious equity issues with shifting resources from bus to rail – again, not because of anything inherent to those technologies, but simply because of who happens to use them in modern American cities. In most cases, shifting funding from bus to rail means shifting funding from services disproportionately used by lower-income people to ones with with a stronger middle- and upper-middle-class constituency. And while transit ought to be viewed as much more than just a service for the poor, we can’t ignore the equity impacts of transit policy.
In light of all this, we have to stop talking about America’s bus woes as a ridership problem. All the evidence suggests that when service is strong, and buses are a reliable way to get to work, school, or the grocery store, people will take them. Instead, the problem is that fewer and fewer people have access to that kind of strong bus line. If we care about ridership, we need to restore and enhance the kind of transit services that people can rely on.
* “Heavy rail” includes traditional subways and elevated trains found in cities like New York, Washington, and Chicago. “Light rail” includes many newer systems, with smaller train sets that are sometimes designed to run on streets as well as in their own right of way. Rail lines in Seattle, the Twin Cities, and Dallas are typical of light rail. “Commuter rail” services generally reach from central business districts far out into the suburbs, and are meant almost exclusively for peak-hour workers.
Ideally, hub-and-spoke rail would free up previously radial-route service hours to then be reinvested into crosstown frequent network. However, if an area’s land use patterns of workforce housing and service-sector jobs are neither very linear nor very dense, then new crosstown routes fail to be as productive as old radial routes, even if having similar levels of service.
The socioeconomic inversion of US cities is resulting in those with the fewest cars living in places built for cars, while those with the greatest means living in places without the need of a car. This is just a huge challenge for cost-effective bus service in the US. These increasing patterns kill the productivity of transit, in spite of growing public support.
“Second, you might argue that service and ridership are linked, but the other way around: as ridership declines, agencies cut back on hours and frequency to match demand.”
Whoa, who’s doing that? Are there really agencies out there cutting bus hours without having to? Adjusting service levels to meet demand is one thing, but not putting those hours to better use is another. If there are any agencies doing that, please send me the money saved so that I can use it in my region. Thanks.
This is a really strange article, and isn’t typical of Human Transit, where you try to be data driven. Here the author doesn’t like the data and tries to make it based on race and income.
Using ridership trends over the past year isn’t very meaningful. Generally once systems have set service schedules they don’t change much for long periods of times unless there are extreme events – ridership overwhelms the service level, creating increased service, or a financial crisis. Then a service which has been losing riders over many years, say 3%/year, is on the chopping block.
These data seem to show two things. One is that the marginal cost of operating rail service is low. So even if there are some cuts in a recession, they get restored when revenues improve. The other is that riders, at least in USA, prefer rail. They’ll make decisions on where to live or how to commute that take the mode into consideration.
But taking transit funding into class warfare is a losing direction. Transit and land use are tightly interrelated. And higher density and more transit service benefit lower income people. Putting class into it tends to end up serving the ends of people who want to the lowest possible investment in transit, especially infrastructure, which in turn results in development patterns that are unfavorable for transit. Transit that is readily available for all and increased density are what create opportunities for all.
I disagree with Carl. It’s not “class warfare” to make transit decisions based on how many people of any class are able to take transit. Given that light rail lines serve a few places while buses serve many places, that generally means increasing bus service. And while light rail is often cheaper to operate than buses, once you prorate the cost of constructing light rail over its lifetime, I expect that is no longer the case.
“while light rail is often cheaper to operate than buses” – per rider, not in an absolute sense
Let us not forget that healthcare costs for drivers are rising faster than inflation as well as transportation costs in general. Additionally, the poor are being moved out of central city areas into the suburbs where it is more expensive to provide transit. Additionally, the FTA likes capital spending over operating, so we have shiny new buses that can’t go anywhere. Additionally, transit leaders are jumping on the sexy streetcar for the gentrified wealthy urban dwellers instead of serving the poor. Additionally, many transit agencies offer downtown circulators at lower cost or free for gentrified wealthy urban dwellers. Additionally, it’s trendy now for transit consultants to promote grid systems after a couple decade of promoting the spoke-and-hub just so they can act like they’re coming up with new(old) ideas resulting in new productive routes. Additionally, transit agencies are failing to fight urban sprawl and instead are aiding and abetting it by providing more and more express commuter service so wealthy people in the exurbs can get to their jobs downtown. Additionally, transit consultants lack the courage to tell transit agencies that their existing models of productivity/sprawl will lead to financial ruin, that the debate is over, every single route should be productive. And quit using the word coverage and start using the word sprawl and the term aiding and abetting sprawl.
…act like they’re coming up with new(old) ideas resulting in LESS productive routes.
First of all, I think vehicle hours would be a better metric to measure bus service than vehicle miles because cost is usually thought in terms of hours rather than miles. If increased traffic congestion causes an increase in running time then some trips may need to be cut, resulting in fewer miles but the same overall hours.
Second, the data presented here shows the elasticity of transit service change may be greater than had previously been believed. 1.0 is a lot greater than the oft-quoted 0.3.
A 5% decline in bus miles from 2000-2013 doesn’t strike me as transit armageddon, especially considering over a 20% increase in rail miles. I would hope transit agencies would cut parallel bus service when a rail line opens – otherwise it would be wasteful duplication.
I’d also the first graph with absolute numbers and not percentages, since there is such a huge difference in total miles between buses and rail.
@ Chris,
The 0.3 elasticity figure is fairly accurate (0.1-0.5 depending on the route). However, this is a measurement route-by-route.
The plot showing a 1.0 ratio is attempting to measure the elastic demand on a network rather than just a single route. Unfortunately, the effect is amplified in the plot due to both ridership demand and transit expenditures being correlated with the size of the local economy. Neither the plot nor the MTI study checked independently for local economic acitivity and transit supply, and I doubt they could have.
I’d stick with an elasticity value of 0.3 for most US bus systems.
A word to people insisting every route in a bus network “should be productive” – of course we should restructure networks periodically to avoid too much redundancy, routes that are overly indirect, etc. But on the other hand :- for the overall _network_ to be effective, especially if part of your goal is to make car-free living a choice for some and a less-onerous necessity for others :- the network really does need to allow you to reach most major and a good proportion of minor destinations in a city. And sometimes people need to use those less-used routes to connect onto trunk routes etc – so the workable approach advocated by researchers into effective networks is that the most heavily-used routes should cross-subsidise the supporting routes to a degree.
Bus-only systems have seen a significant cut (60%)in dedicated capital funding since the passage of MAP-21 in 2012.. Many such systems report increased spending on operating to keep older fleets running and to make daily pull out, creating an environment where service cuts occur — which impacts ridership. Thoughtful article, this.
I haven’t seen much discussion anywhere that we may be seeing the same broad trend in transit use that we are seeing in driving: overall VMT is flat for many years while per capita driving is decreasing.
People seem to hopefully assume that this is due to people switching to transit, bicycling and walking, but I haven’t seen any data to support that. Seems more likely that it is a broader society wide trend of people moving about less likely due to aging population, rise of telecommuting, and online retail among other factors.
The drop in driving is great news. If a similar thing is happening in transit, it may be trickier to adjust to.