Eight years ago, I experienced 10 seconds of Elon Musk’s attention. The occasion was my criticism of his idea, now being implemented by his Boring Company, that the future of urban transportation was cars running in tunnels — tunnels that he claimed to be able to build so cheaply that there would just no longer be any barrier to building as many as we might need. It was clear to me at once that this was a very low-capacity solution to a problem that required much higher capacity — the kind of capacity only provided by real public transit.
I have written several other articles on these themes over the years, many mentioning Musk as a technicolor example of common fallacies in tech industry thinking about urban transportation. In the new edition of my book Human Transit, I laid out a more thorough critique of the most developed example of the Boring Company vision, the “Vegas Loop” that serves the Las Vegas Convention Center and nearby hotels. It had just been approved for a large citywide expansion featuring over 60 stations. I had studied whatever I could find explaining the concept — which wasn’t much — and explained why I felt that a system that sort-of worked with four stations would be a fiasco with more than 60.
But I must admit that until last week, I hadn’t actually ridden it. Now I have.
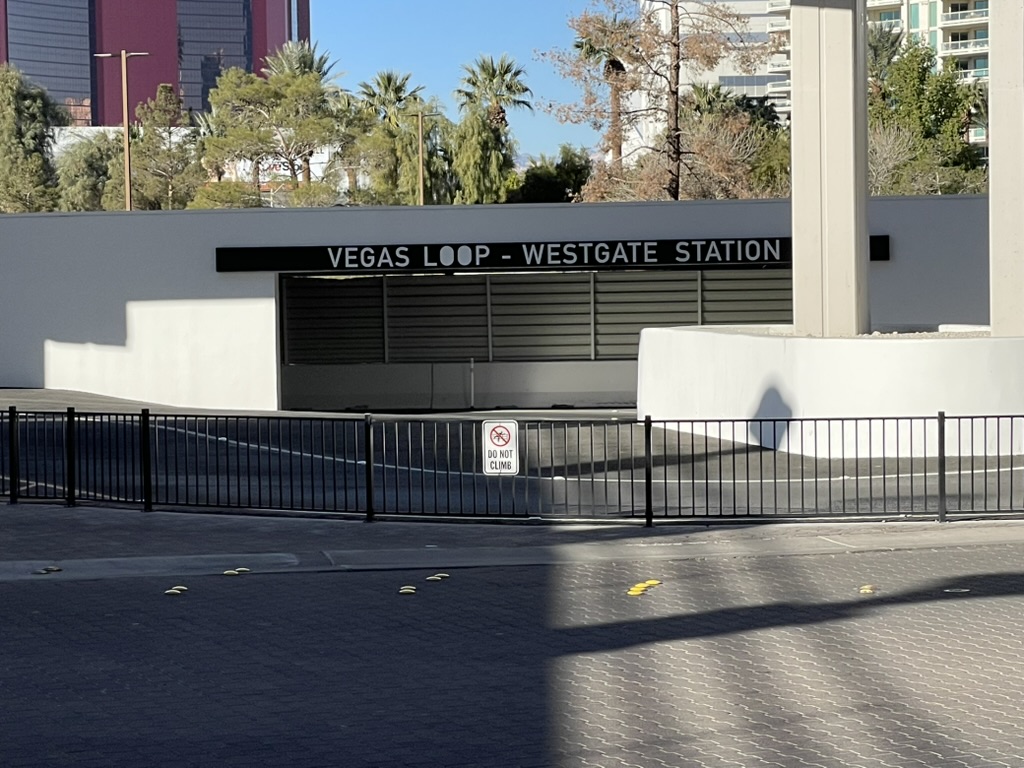
Last weekend I found myself in Las Vegas for my nephew’s wedding, and had a few hours to spare. So I did some walking, rode the monorail, and tried the Loop. Until recently, the service had been confined to stations within the Las Vegas Convention Center complex, and thus not always open to the public. But now there are two stations outside that complex, Westgate and Resorts World, so I rode from one to the other.
The monorail delivered me to Westgate station, where a short walk took me to the Westgate Loop station.
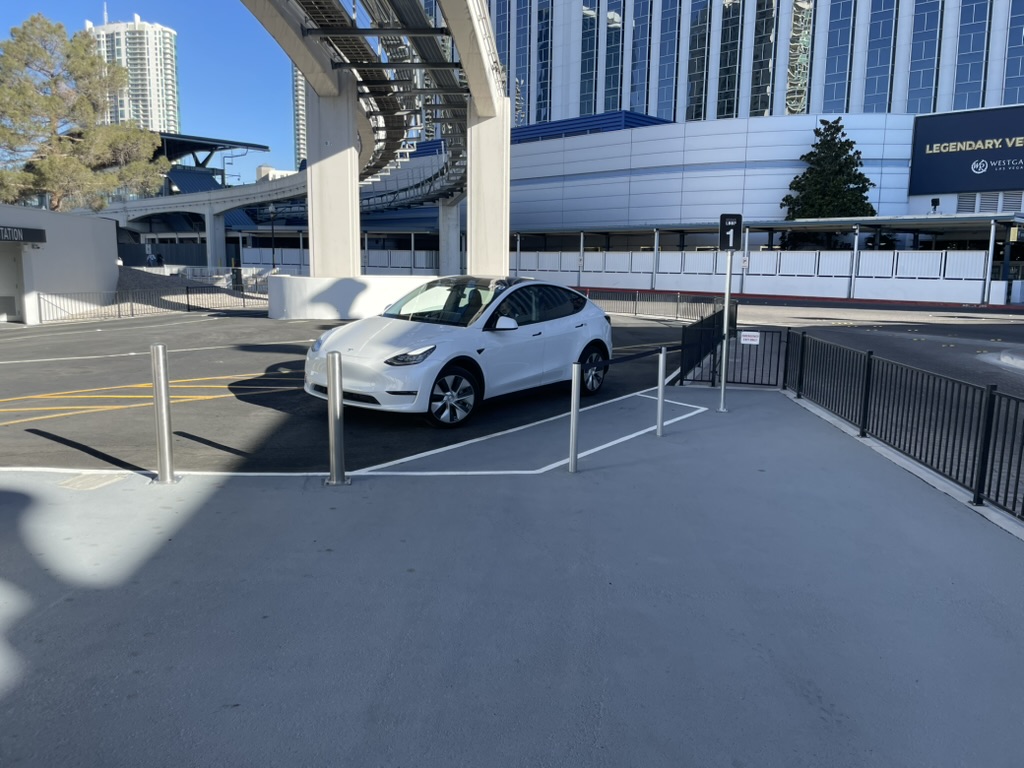
An attendant was there to help me pay my fare with a QR code, and pointed me to a car. It was about 9:30 on a Sunday morning, so I knew I wouldn’t be seeing the Loop’s alleged ability to handle big crowds. Instead, there was Tesla parked at the station, with a friendly driver. One odd detail is that he was parked on his left, so that I had to go into the roadway to board on the right. Other than that, it was exactly like boarding an Uber or Lyft Tesla, including the perennial difficulty of hooking up the seatbelt.
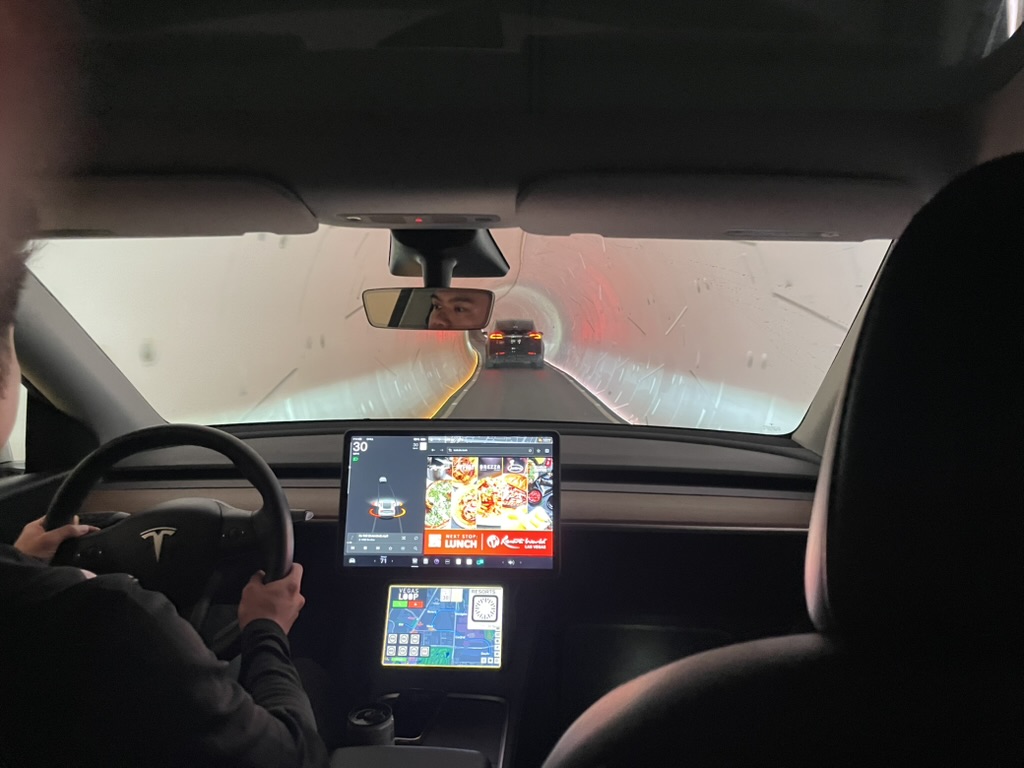
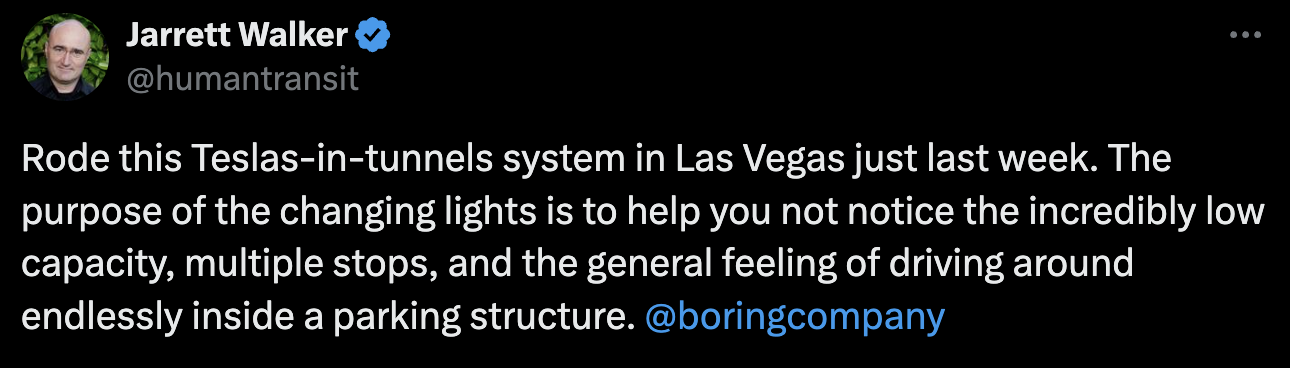
Once I was secured, we took off, driving slowly through the narrow tunnels. Two screens provided ample distraction, about half of it advertising.
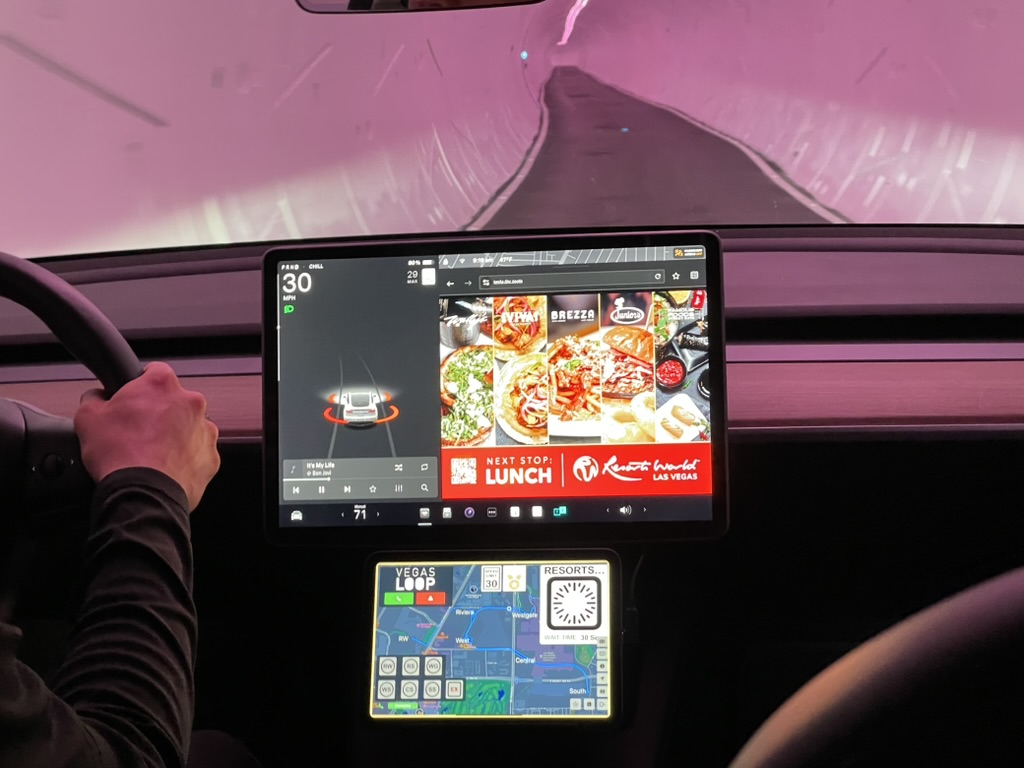
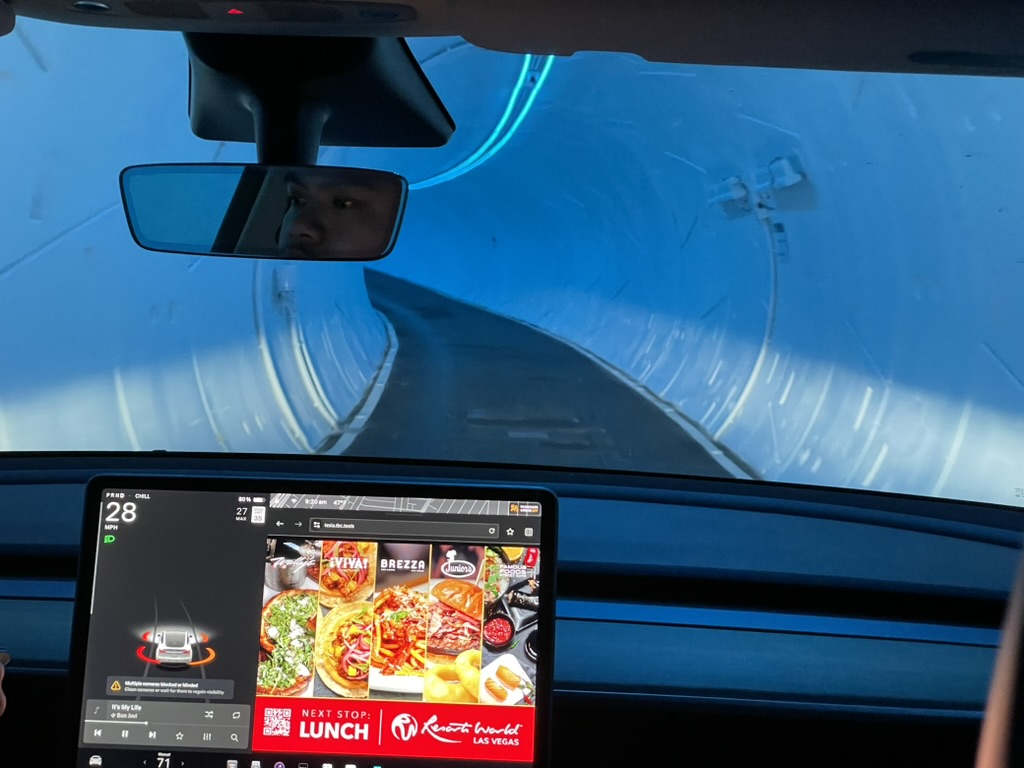
Famously, the colors of the lights in the tunnels change — as lights do all over Las Vegas. This was supposed to make it feel modern or fun. What I saw instead was the narrowness of the tunnel, barely wider than the car. I wondered about emergency exits.
Finally, we arrived, queued behind one other car, at an underground intersection, with a standard red-and-white-striped barrier blocking our path. A man was standing around in a bright yellow jacket, much like the people you’ll see standing around in many kinds of transport infrastructure, not doing much but presumably ready to jump into action as needed.

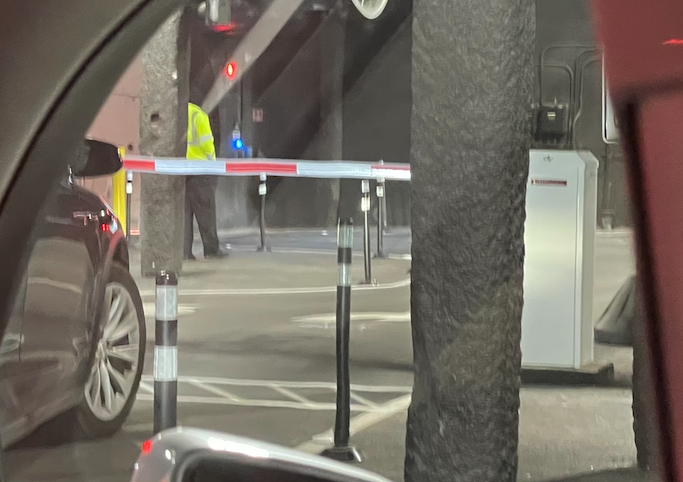
Looking to my right, the view partly obstructed by the screen’s reflection in the window, I saw we’d arrived at a complex underground intersection. There was a little booth for the man, as though he might be going to collect tolls. Except for the reflected screen, it all looked like infrastructure from 1970 or so.
We waited here for over a minute, which happens sometimes in public transit but is very much not the Boring Company pitch. It appeared that the next bit of tunnel we needed to use was “single-track,” used by cars in both directions, so we had to wait for an oncoming car to come out of it. Then, our barrier lifted and we went on our way.
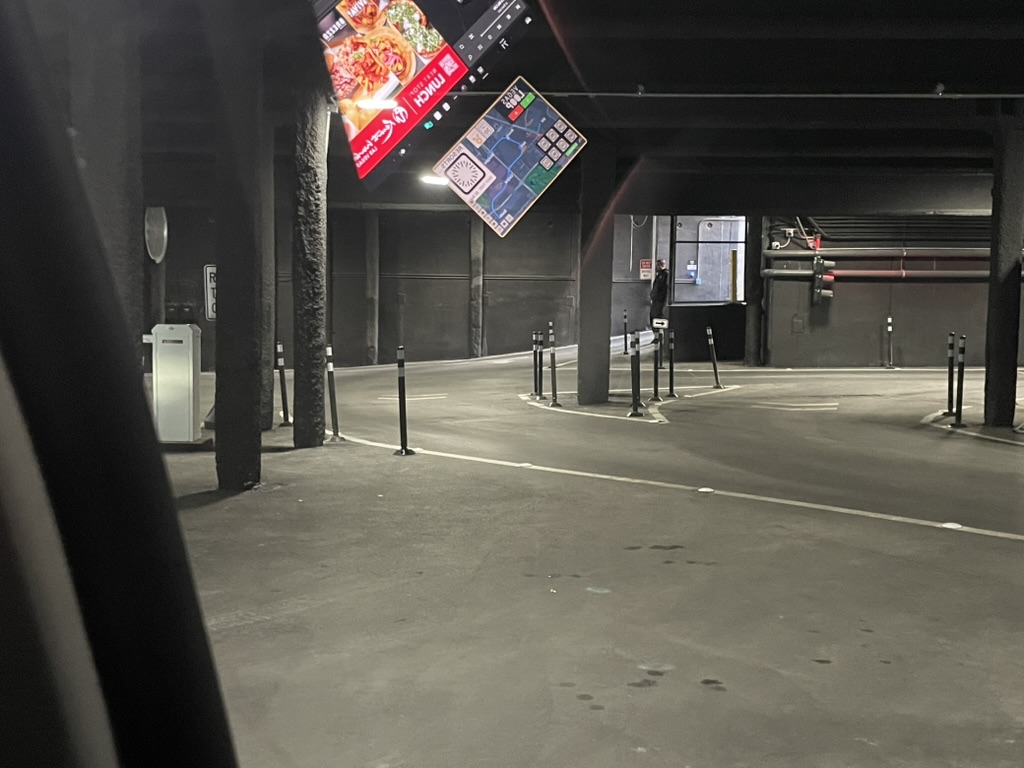
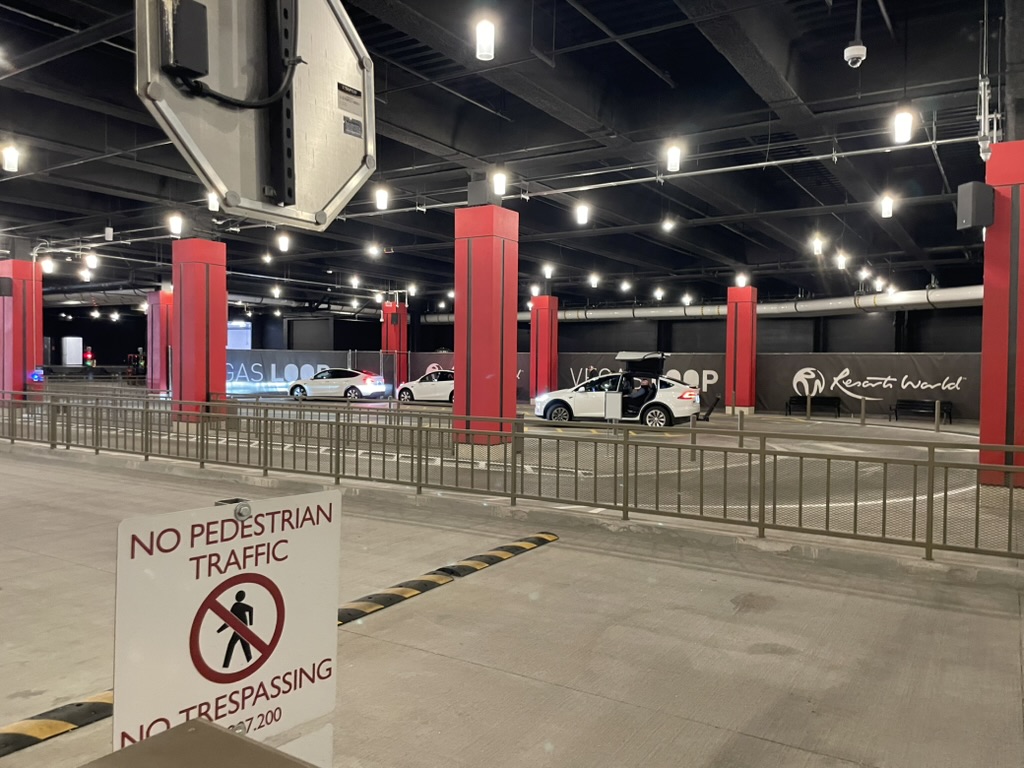
We arrived at our destination, a trip of about 4 minutes of which one was spent waiting at that intersection. This station, deep under Resorts World, had the same features: A QR code to pay the fare, an agent in a yellow jacket, and some people standing around.

Walking out, I gazed back at the station. It looks exactly like three Uber Teslas lined up at a curb in a parking structure, a space dominated by roadways that scream “keep out” to the pedestrian.
So, I tweeted:
My most loyal reply-guy was right there in an instant.
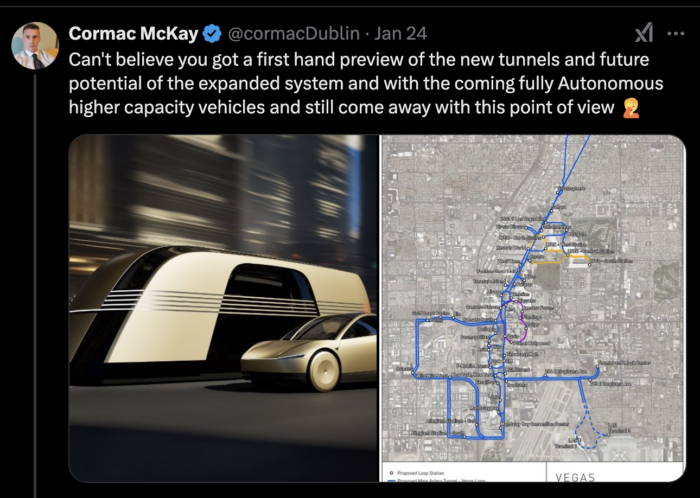
And this was the perfect reply to make my point! To a certain kind of tech fantasist, their vision is so self-justifying that the only people who would question it must be those who haven’t experienced it yet. This guy really thought that somehow, riding a Tesla through a tunnel (as opposed to reading and watching videos about it, which I’d done at length) would be a revelation that would overcome all my professional doubts about how such a low-capacity system could possibly scale. At the same time, he was sharing images of the much better Vegas Loop of the future, with an extended network and sexier driverless vehicles. This amounted to admitting that experience of the current demonstration project is not adequate to convey how cool this is, and how that coolness will supposedly someday get me to stop thinking about math.
Fortunately, there are a few journalists who share my skepticism about this project. ProPublica did a recent piece focused more on the project’s failure to keep up its agreements with local governments that allowed it to be built. They note that the big news event in May 2023, the Clark County Commission’s approval of the expansion plan, featured an opaque agenda item that didn’t even mention the Vegas Loop explicitly. More importantly, they note that the kind of justification document that would exist for any publicly funded project just doesn’t seem to exist. The Boring Company does not seem to want to show their math, either on their own website (where they should expect curious transport geeks to be looking) or in a submission to local government.
It’s remarkable to me that the Clark County Commission approved this, with the head of the convention bureau calling it “the only viable way” to manage traffic on the Las Vegas Strip. Obviously, if there are no other options, there’s no need for analysis, but every transport planner knows how absurd that is. Other options include:
- extending the monorail north to downtown and south to the airport, or
- building a proper rail subway (the most expensive option) or
- developing light rail or BRT on the surface of Las Vegas Blvd, taking 1/3 of the traffic capacity but carrying far more than 1/3 of the corridor’s person trips, so that traffic won’t get worse as a result. (San Francisco’s Van Ness Avenue, where this was done in 2022, is now a great proof-of-concept.)
Was it easy to say yes because the Boring Company wasn’t asking for public money? Certainly, but they are still taking something valuable: an enormous amount of underground real estate in public streets. This will have the effect of preventing a properly scaled subway from ever being built because its path will be blocked by this warren of too-small tunnels.
I don’t expect to influence the debate in Las Vegas from afar. The region has its own distinctive politics, and a particular notion about how to serve and entertain people that is unrelated to the principles of liberating urban transport. But like many, I do find it fascinating as a case study, one that other cities should think about.
If this technology escapes from Las Vegas and threatens a bigger, denser city, that will be a more critical battle. In 2022, Vox’s Avishay Artsy and Alissa Walker did a roundup of the state of action at the time, noting all the elected officials around the US who were expressing vague support for Boring Company projects. But they also noted that the company tends not to follow through when they encounter the typical legal and infrastructural complexities of almost any large city. Is some of this excessive regulation? Maybe, but some of it is just people demanding that before you build something this impactful, you should lay out the math, and answer questions, to prove it’s the best alternative. That’s all I’d be asking too.
Did you ride the Deuce as a contrast to the Vegas Loop? A 24 hour double decker bus service that serves the entire strip and Fremont street?
That particular trip takes 30+ minutes by public transport (mostly walking to and from stations) or 10 minutes by car. Making the trip in 4 minutes (less without the interruption) seems pretty good?
I lived in Las Vegas for 30 years and was a journalist at the Review-Journal for a number of years. Great piece, super informative and truthful. You’d think that whomever is developing this would have made the interior slicker. And the stations would have a fancy LED screen or something.
I’m not sure how a series of cars in tunnels underground is better than any public transport options on the strip. It’s really untenable.
It really doesn’t matter what kind of transit Las Vegas builds or fails to build because that city has no viable long-term future. Vegas is living beyond its means in terms of water. The water supply of the Colorado River is already over committed in relation to the demands of people, agriculture, and industry along its entire length. Since Las Vegas offers no useful product, only the alluring scam of gambling, when hard decisions have to be made, cities and towns that produce essential products will get the water, and Las Vegas will shrink to being a small railroad way station and large military base, both of which will be largely automated. Phoenix and LA will also face water shortages, but at least they produce useful products. Los Angeles might be able to get useful amounts of water by desalinization, and they are building a fairly big transit system to move their population around. If only they would stop expanding their “free”ways and allowing people to build houses in unsafe areas prone to frequent fire, landslide, and occasional flood. Much of the Southwest faces the same Climate Chaos, water, housing, and transportation challenges, but only a few places are meeting those challenges.
You’re making the questionable assumption that this country is sensible with its priorities. We will kill ourselves to make short term profits over long term gains every time.
I think this is transportation vaporware. I’m sure Musk and some of the other engineers feel like they just need more time and it will all work out. That is common for vaporware. But eventually folks want you to prove that you can actually produce something of value. It then fails because the fundamentals aren’t strong. They haven’t built anything remarkable (a narrow tunnel — wow!) and promises of “Just wait! It will grand!” seem ridiculous.
“ too-small tunnels.”
Are they really too small for mass transit? How wide are they; how wide are the London deep level tunnels (i.e. the Tube)?
As you can see they are barely wider than a Tesla, far too small for any public transit use.
This is the thing, these tunnels are the same size as the Underground, so in theory, that rolling stock could be used. Which has a lot higher capacity. And could also operate remotely, with less technology to fail.
Otherwise, there’s a reason redditors call it “Elon’s Narrow Urethrae”.
And Stephanie has a good point, long term, there’s not much of a long term for Vegas.
If the tunnels are large enough to take Underground sized rolling stock, then getting 68 miles of tunnel would seem to be fantastic. A little searching showed Vegas Loop tunnels have an inside diameter of 12 feet, this is certainly wide enough for a mass transit vehicle (properly designed) not just a car.
Musk might be onto something. At 13.5 feet outside diameter, these tunnels are about 1/3 the excavated volume and 56% the tunnel lining of a mass transit tunnel (~24 feet diameter). That is a large cost savings. As @Scratchy notes, all modern transit should be driverless/automated*. You want driverless vehicles to be smaller and come more often, because running twice the vehicles does not incur twice the salary costs, while reducing wait time is valuable to riders (“frequency is freedom”). Although companies are walking back work-from-home programs started during Covid, the data continues to show lower total transit ridership, with less rush hour peak and more all-day / weekend riders. If this persists, a medium capacity, high frequency system using smaller tunnels might be exactly what you want, meeting travel patterns while providing better service (less waiting at stations) for lower cost. Vancouver SkyTrain has a nominal capacity of 25,700 pph at 90 sec headway, compared to BART at 48,000 pph at 150 sec headway. SkyTrain could theoretically reach 32,256 with the new trains at 75 sec headway. Two such lines at the same cost as a single full sized heavy rail line looks attractive, with similar capacity but the covering two corridors.
And then there is the potential of pod based transit. Everyone knows “trains have more capacity than busses” but the tunnel moving the most people into Manhattan is the Lincoln Tunnel bus lane, not the subway tunnel or tunnel into Penn or Grand Central. An train carries more people than a single bus, but trains need space between them. In the Lincoln tunnel the busses are an infinite train, with one bus after another and no gaps. This works because the trains don’t stop in the tunnel, they spread out at the Port Authority Bus Terminal. But you could have vehicles in a Vegas Loop tunnel continuously flowing by having driverless cars turn into another ‘lane’ at stations. 30 foot vehicle spacing and 30 mph this would be about 5,000 vph, or 5-20,000 pph depending on seating. Japanese Kei cars are just under 5 feet wide and seat 4-6, so you could have two directions of traffic in a Vegas Loop tunnel.
Then incorporate destination dispatch. This technology has existed in elevators for over a decade: instead of getting on an elevator and pressing a button to choose the floor, you choose the floor on a screen in the lobby and the system tells you what elevator to get on, placing you with people going to nearby floors, optimizing capacity and minimizing stops. Combine this with the layout above and you have people pressing a button to choose their destination and being told which vehicle to board (either by placing you with someone going to the same station, or summoning a vehicle already going to that station pull out to pick you up). You then proceed to you destination either non-stop or a stop or two. This not only minimizes wait time but also speeds travel time.
Note that I am not describing “Personal Rapid Transit” as futurists often describe it, with door to door service anywhere you want. The system above would involve vehicles captive to a single line, with fixed stations. Think of an elevator, where you can travel straight from one floor to another without stopping but can’t go sideways to the building next door – just turn it horizontally with stops every 1200 feet instead of every 12. Such a system would be medium-low capacity, but just because a solution is not right for Midtown Manhattan does not mean it isn’t right other places (including other places in NYC!), and again post-Covid travel patterns argue for more lower capacity lines not fewer very high capacity ones. The system I describe also has its own geometric issues to consider (if vehicle flow is constant at max capacity, where do they go when travel demand is lower? Do empty vehicles always drive around?) I also grant that Vegas Loop isn’t fully using this model, but appears to have some elements (stations where the cars pull out to load while other traffic passes by and keeps using the tunnel). They may be inching that way, and I expect a system that offering little-to-no-wait express service at twice the speed of a conventional subway/bus is probably a better bet for future transit than current heavy rail or bus, except for the highest demand locations when pod based capacity is too little.
Side note: another thing Musk may be on to is placing the propulsion (batteries) and controls on the vehicles instead of making it part of infrastructure. I’m guessing part of the reason the tunnels are so cheap is that they do not need miles and miles of electrical and data cables for traction power or signal systems.
*Being automated does not require rolling stock/rails. Companies like Waymo are operating driverless vehicles on regular city streets right now, so having driverless cars inside of controlled tunnels is clearly within the state of the art.
PRT is exactly what you described.
Leo, I am a bit hesitant to call it “Personal Rapid Transit” because to many people this term represents ‘door-to-door transit’ aka taxis, and which will not work for the geometric reasons Jarret explains – if a lot of people are going to one spot then there will be more vehicles than the tunnel can hold and you just have traffic. My proposed system has distinct lines with vehicles captive to the line, requiring connections for people starting on one line and ending on another, instead of a “Personal Transit” journey from any origin to any destination. The “personal” part of my proposal is just getting people to skip intermediate stations for faster speed (no unnecessary stops) and higher capacity (when a vehicle does stop it doesn’t block the tunnel).
That said, the Morgantown PRT has a mode that operates very similar to this structure, although I believe just when traffic is light without the destination dispatch function to summon the right vehicle and keep the journey non-stop when traffic is heavier. It is worth noting that Morgantown PRT gets higher ridership per mile than any full-size subway except NY, Boston and Philadelphia. Whether this is because of geography (Morgantown is very linear in a mountain valley) or the University (students always have high ridership per capita) or the benefits of the PRT system I can’t say.
Onux: “The “personal” part of my proposal is just getting people to skip intermediate stations for faster speed (no unnecessary stops) and higher capacity (when a vehicle does stop it doesn’t block the tunnel).”
Do you mean a limited-stop bus? Or as the U.S. calls it: “bus rapid transit”?
Onux: “It is worth noting that Morgantown PRT gets higher ridership per mile than any full-size subway except NY, Boston and Philadelphia.”
That’s a trick of algebra, but not an endorsement of the usefulness of the Morgantown PRT. Those other subways have lower ridership per mile because they run longer distances on account of serving major cities.
The higher ridership per mile is because a lot of people within the University of West Virginia campus are taking a lot of short trips. One rider going a half-mile equals 2 riders per mile. (1/0.5 = 2/1 = 2)
Onux, what you described is a Xiamen-like transit system therefore, but replacing each bus with a pod. It’s ok when you accept the cost.
@Onux, Elmo is not onto anything.
The Pedestrian Observations blog effectively took this line of thinking down because Elmo has never shown his proof. Civil engineers had asked for evidence of a “cheaper means of digging dirt,” but those numbers have never been revealed.
The hypothesis goes that tunneling can be measured by the unit cost of every cubic foot displaced to make the tunnel. Smaller tunnel = lower unit cost of displacement = cheaper.
Except this is an accounting identity but not a value-adding engineering process. If it were the latter, the engineering paradigm would shift and become the industry standard, supplanting conventional practice.
Engineers know that a lot of costly, complex infrastructure projects like tunnels involve a lot of fixed costs: the tunnel boring machines will cost the same to procure whether you’re displacing one cubic foot of dirt or miles of it. There’s also labor costs, because construction can be mechanized but never purely labor-free. Then you have extras like geologic surveying, disposals of the dirt, and station construction.
If somehow Elmo subverted a profession’s knowledge, why doesn’t he put the establishment out of business? Likely: It’s because if he were forced to show his work, he’d be giving up the game.
Much like a lot of what he says, it’s based on vapor and ego.
And not much else.
Elon’s Boring Company Is Planning to Build a 10-Mile Tunnel in Dubai for Some Reason
The billionaire’s infrastructure firm wants to bring its underground tunnel project to the Middle East.
“The initial Dubai Loop pilot will have 11 stations and 17 kilometers of tunnel and will transport over 20,000 passengers per hour, with the goal of ultimately expanding into Dubai Loop, a next generation underground transportation system throughout the Emirate of Dubai.”
https://gizmodo.com/elons-boring-company-is-planning-to-build-a-10-mile-tunnel-in-dubai-for-some-reason-2000564369
There are many things I like about the Las Vegas Loop as a concept. I mean the current concept, not the original 3D video with the elevators and people taking their personal cars on sleds to dense urban areas.
I like the idea of PRT. I like the idea of getting into a waiting vehicle that takes you to your destination (within the entire system) without stops or transfers.
I will be happy to see the Las Vegas Loop expand and thrive. I’m not 100% sure that it will, but I think it’s the perfect testing opportunity, because unless things change the Boring Company is paying for the construction. As long as they keep building, it means they think they can make money in the long run, and the straightforward way they make money is passenger fares. If it proves not to be profitable, they will cease digging new tunnels, and the system will remain unfinished, or they’ll turn to the local governments for financial assistance. I don’t think they’ve done that yet, so their internal math must be telling them to keep going.
The other way they make money is by selling projects in other locations. They’re not likely to foot the bill themselves for these other projects. So Texas A&M and Dubai will have to be given a price, and it needs to be a price that will make money for TBC, and it needs to be a price that A&M and Dubai are willing to pay. Whether they show us the math or not, the math result has to be beneficial for both TBC and the customer.
If the math doesn’t work and the LV Loop remains just a shuttle service between the convention center and a few hotels, my disappointment is going to be tempered by my enjoyment of seeing Elon Musk fail. But I started liking the Las Vegas Loop before I started disliking Elon Musk, and my reasons for liking the Loop don’t have anything to do with him.
Kevin Bailey. Always great to see a comment disagree with me so thoughtfully. Yes, it would be nice if it worked. I can see, geometrically, that it doesn’t, but yes, the experiment is being done, so you’ll find out your way.