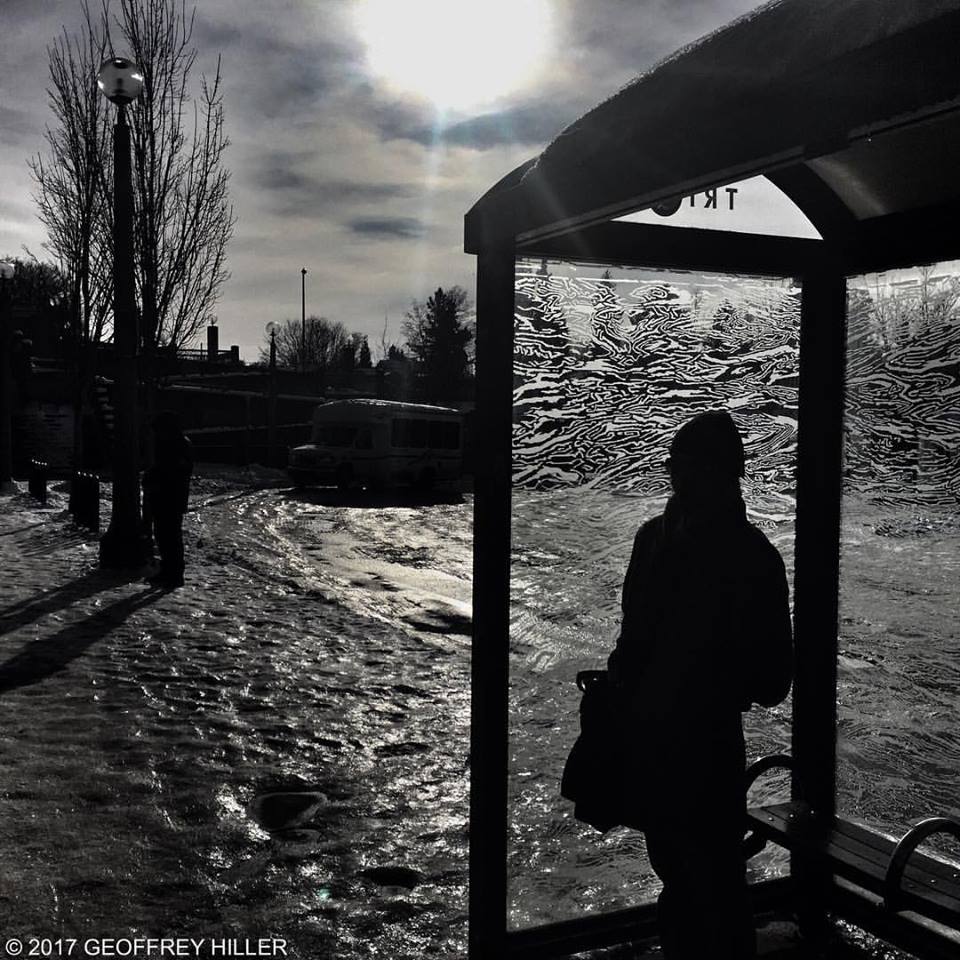
What do you think of these people? Photo by the (great) Bay Area public artist Todd Gilens.
Downtown business leaders! I know how much many of you support transit, and I love working with you folks, but here’s a hazard you need to think about.
Cleveland Mayor Frank Jackson has announced that new bus lanes that were designed into city’s main square will be closed to buses, thus choking the bus system’s circulation at its very heart. Citylab has the story. The local newspaper of record, the Cleveland Plain Dealer, has an editorial in favor of keeping buses out, citing three points:
*The square is far more popular than anticipated. …
*Keeping buses out has greatly enhanced the pedestrian experience. …
*In an age of terrorism, barring large vehicles from being able to drive into crowded public spaces also matters. Cleveland Public Safety Director Mike McGrath has pointed out that if Superior Avenue is kept open through Public Square, a “determined person” could use a truck or other vehicle to drive into crowds gathered there. …

Electric Retractable Bollard, SecureUSA.
(Terrorism is a distraction, of course. The way to prevent someone from driving a heavy vehicle into a public square is to install retractable bollards, which drop for emergency vehicles and transit. Fixed bollards are also used to define a transit path across a space, and protect the rest from vehicles.)
But really: Would city leaders be saying this if the service being banned were a streetcar/tram? Of course not. Streetcars supposedly attract people that the business community values. So when I read this …
[City Councilor] Zack Reed, … as reported by Cleveland Scene’s Sam Allard, [suggested] that the mayor is in the pocket of downtown’s corporate interests who view transit riders as “low-lifes” and “thugs.”
… I have to say that sadly, from personal experience, this accusation against downtown business interests is sometimes (sometimes) true, and the blowback against it is understandable.
Business leaders: I know you really want a transit system that a more diverse group of people will use, but you can’t promote transit while insulting the people who use it now. It doesn’t make sense. Nobody will choose to join a category of people, “transit riders,” that you’re marking as unimportant or even despised.
In the course of my transit planning work in several US cities, I’ve been quietly taken aside by a downtown business leader and told that of course those ugly buses have to be gotten off of the main street, and put out on some back street where the loading docks are. And sadly, I have sometimes been told the same by advocates of public space, often credentialed New Urbanists, who insist that their aesthetic disapproval of the bus should outweigh people’s need for useful, reliable transit service. Most of these latter group don’t really understand the impact of those comments, but I see the effects: remote, unsafe and/or inoperable bus facilities hidden from the public eye.
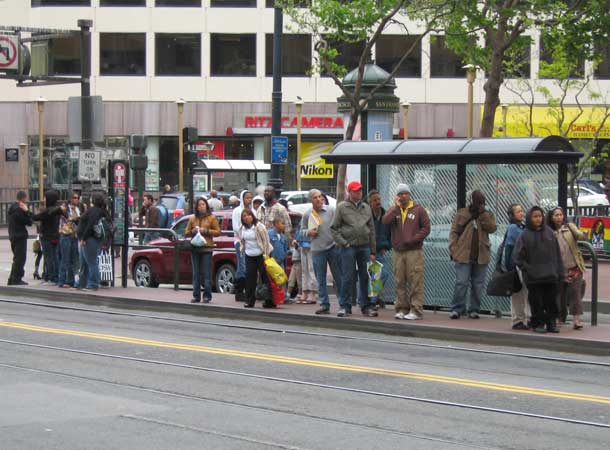
Now and then someone makes the class-segregation narrative explicit. For example, in one US city where I worked years ago, a downtown business leader explained to me that “those people” waiting for buses on the main street were deterring customers from visiting businesses, and “making people feel unsafe.” The candor was refreshing: the problem isn’t the buses. The problem is unwanted people who do not deserve to be respected by the design of the city — including, of course, many of the business community’s own employees.
This leader also assured me that women would never feel comfortable walking through these crowds — contrary to the view of professional women who were working with us on the project. The stops in question did have a lot of people waiting at them. Like any busy place they attracted the usual diversity of urban characters, including street preachers, small scale salesmen, and self-styled performing artists, and perhaps one or two petty criminals. But people are rarely attacked in the middle of largely law-abiding crowds.
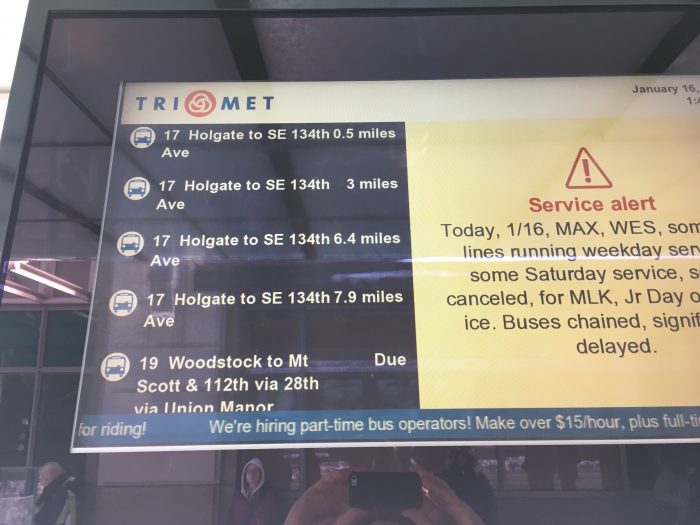
This problem actually had an easy solution. Robust real-time information, available by text and voice as well as in smartphone apps, encourages people to come to the stop only a few minutes before their bus leaves. Bus stops have become noticeably less crowded in communities that have rolled these out, as you would expect. That also means, business leaders, that people waiting for the bus have more time to patronize nearby businesses.
But too often, the business community’s solution is to move the buses onto a deserted street where nobody will see them, and also to “spread buses out” so that no stop would be as busy. This “solves” a problem of the “feeling of safety” by creating a problem of actual safety. Bus riders have to walk to an isolated street and wait in a place with fewer eyes to witness crimes against them. And of course, the other effect is to make the transit system less attractive, so that fewer people with choices will use it. Connecting from one bus to another, for example, would be harder to figure out and require longer walks.
Now, let’s honor the experience of downtown businesses dealing with this situation. A crowded bus stop in front of your business can be disruptive, depending on the kind of business you’re in. Transit agencies do what they can to manage these impacts, but in the long run, a bus stop is an essential piece of urban infrastructure. There are types of business that do very well next to a bus stop: convenience stores, fast food, and other “quick visit” places. Good business location decisions always consider infrastructure. Over time, businesses that value bus stops should locate next to them, and those that don’t should locate further away.
But it’s also true, as any planner can tell you, that some businesses will blame government whenever business isn’t going well. On a busy street, there’s always something around you that’s not as you’d like, and it’s easy to decide that this is the cause of your troubles.
Downtown business leaders, you have a critical role in shaping your transportation future. The most critical decision you make is whether to risk letting downtown succeed as a city — a place where everyone has a right to be, and move, and be safe — as opposed to trying to replicate the controlled experience of a shopping mall, where unwanted people can be easily removed.
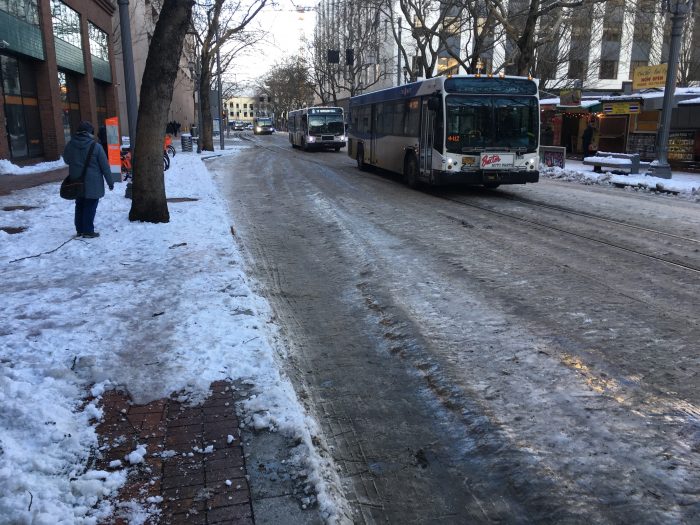
I know you care about your customers, and about their experience. But there’s a reason prosperity is coming back to downtowns, and it’s not because all those unwanted people are being hidden away. Come to my city, Portland (where, by the way, buses run on the most important main streets downtown). In the publicity photos Portland looks shiny and clean, but the real downtown is full of characters. A few are irritating, and many are unfortunate. But very few are dangerous, and people who live here have figured that out. You might prefer to avoid some people’s company, but then you wouldn’t have a city. And judging from the cost of locating there, downtown Portland and places like it seem to be what people want.
Remember: Your businesses are all trained in market segmentation, dividing the society into “your potential customers” and “not your potential customers.” But as soon as you take that habit into the public realm, segmentation becomes segregation. The ethics of business and the ethics of public space are not the same.
Have courage. Welcome the buses and their passengers. Not every business will thrive, but that’s capitalism. In the long run, you’ll have a city where people want to be.
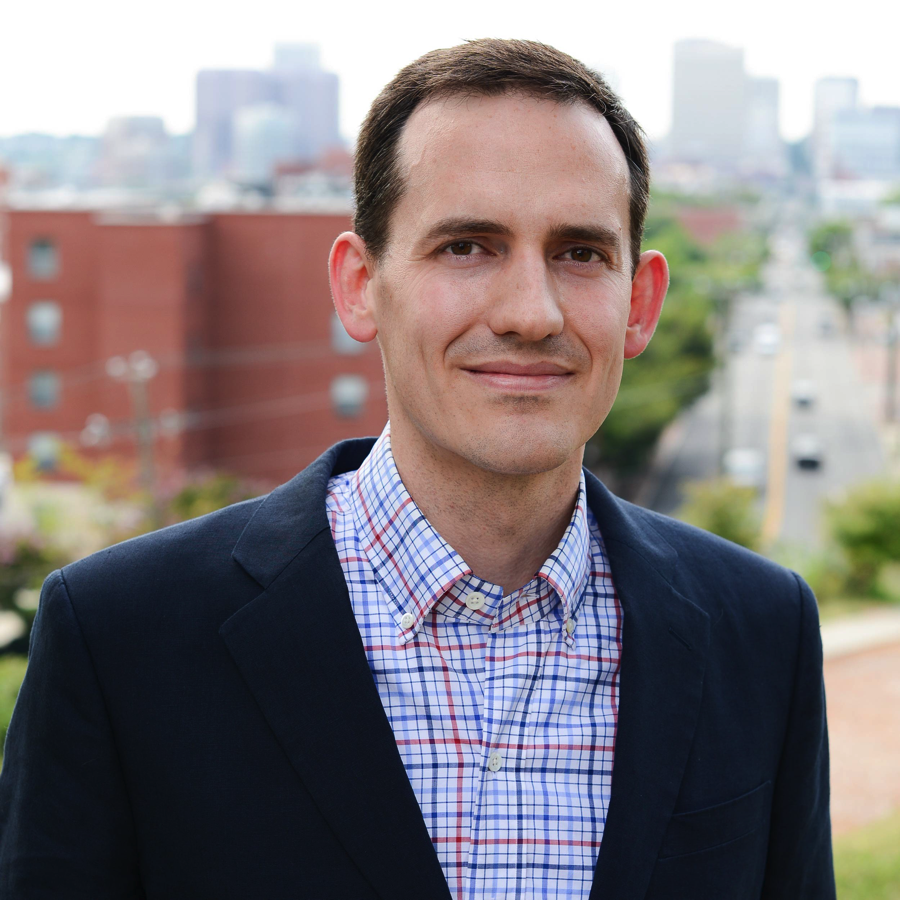 Our tiny firm is delighted to announce that we’ve hired our first East Coast senior planner and project manager.